
Updated August 2026
Denka has been working to promote the use of renewable energy for over 100 years. We have developed technologies for generating renewable energy, primarily hydroelectric power, and technologies for making the most of this precious energy source in chemical manufacturing. Through the application of these technologies, we contribute to the conservation of the global environment and will further focus on our efforts to promote renewable energy, which is one of our strengths.
Our company is expanding its use of renewable energy, including solar power, based on hydroelectric power. In Management Plan “Mission 2030” we have set a maximum renewable energy output of 150 MW as a non-financial KPI and are promoting initiatives toward decarbonization. In recent years, we have been accelerating expansion by diversifying our procurement methods, including considering the introduction of on-site PPA (Power Purchase Agreement) methods at our domestic and international business sites. On the other hand, at Omi Plant, we have shut down the associated biomass power generation facility following our withdrawal from the cement business. Moving forward, taking these changes into account, we will strive to improve our power mix by achieving both stable supply and optimized composition.
Maximum output of renewable energy generation
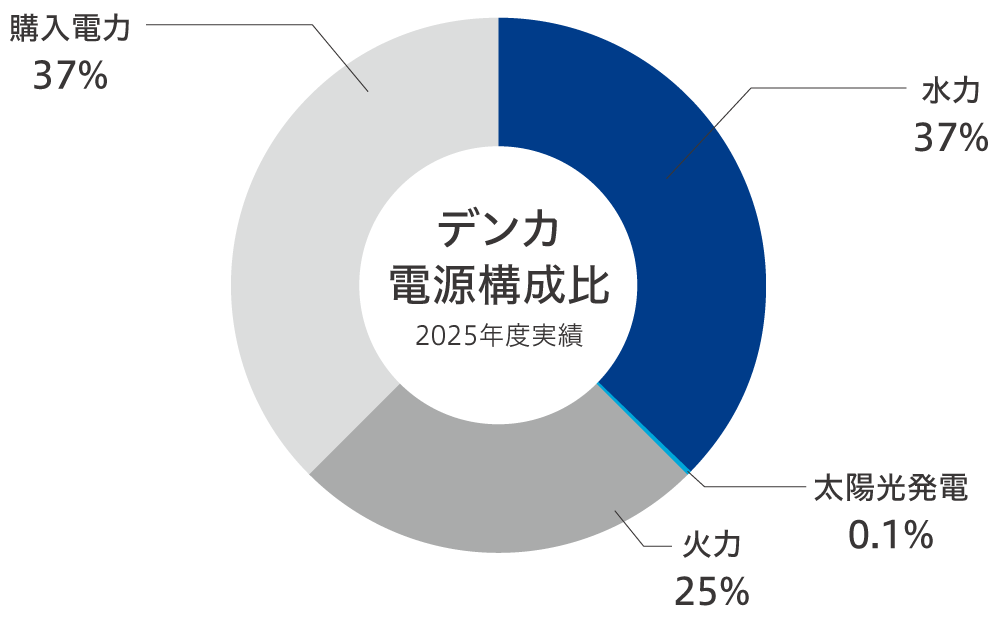
| Item | Scope | Unit | 2022年度 | 2023年度 | 2024年度 | 2025年度 | Fiscal Year 2026 Targets |
2030 Targets |
|
|---|---|---|---|---|---|---|---|---|---|
| Breakdown of Energy Consumption by Source | Hydroelectric | Non-consolidated sites | % | 32% | 39% | 33% | 37% | 36% | - |
| Biomass | Non-consolidated sites | % | 1% | 1% | 1% | 0 | 0 | - | |
| Waste heat power generation | Non-consolidated sites | % | 1% | 1% | 0 | 0 | 0 | - | |
| Solar power generation | Non-consolidated sites | % | - | - | - | 0.1% | 0.1% | - | |
| Fossil fuels | Non-consolidated sites | % | 21% | 23% | 23% | 25% | 24% | - | |
| Purchased electricity | Non-consolidated sites | % | 45% | 36% | 43% | 37% | 40% | - | |
| Total | Non-consolidated sites | % | 100% | 100% | 100% | 100% | 100% | - | |
| Breakdown of Energy Consumption by Source (energy/non-energy) | Renewable energy electricity mix + electricity mix with non-fossil fuel certificates / Electricity consumption | Non-consolidated sites | % | 33% | 40% | 33% | 37% | 36% | 76% |
| In-house Power Generation Capacity (maximum output) | hydroelectric power * | Non-consolidated sites / Domestic & Overseas Key production facilites | MW | 140.29 | 140.29 | 140.29 | 140.29 | 140.29 | 140.29 |
| Solar power generation (including sales outside of the FIT scheme) | Non-consolidated sites / Domestic & Overseas Key production facilites | MW | 2.99 | 2.99 | 3.89 | 5.09 | 7.365 | 9.71 | |
| Waste heat power generation/Biomass | Non-consolidated sites / Domestic & Overseas Key production facilites | MW | 11.1 | 11.1 | 11.1 | 0 | 0 | 0 | |
| Thermal power generation | Non-consolidated sites / Domestic & Overseas Key production facilites | MW | 66.305 | 66.305 | 66.305 | 66.305 | 66.305 | 66.305 | |
| Total renewable energy generation capacity | Non-consolidated sites / Domestic & Overseas Key production facilites | MW | 146.28 | 146.28 | 147.18 | 145.38 | 147.655 | 150 | |
| Total on-site power generation capacity | Non-consolidated sites / Domestic & Overseas Key production facilites | MW | 220.7 | 220.7 | 221.6 | 212 | 214 | 216 | |
| Fiscal Year 2022 Energy Consumption | Renewable energy consumption | Non-consolidated sites | MWh | 530,387 | 519,619 | 473,146 | 518,853 | 493,116 | - |
| Amount of non-renewable energy consumed | Non-consolidated sites | MWh | 1,083,241 | 783,894 | 974,399 | 898,393 | 863,241 | - | |
| Total | Non-consolidated sites | MWh | 1,613,628 | 1,303,513 | 1,447,545 | 1,417,246 | 1,356,357 | - | |
| Energy conservation | Compared to previous year (Target: 99% compared to previous year) | Non-consolidated sites | % | 101% | 101.5% | 98% | 93.8% | 99% compared to previous year | 99% compared to previous year |
Environmental Performance Data
For over 100 years, the Company has positioned hydroelectric power as an important management resource and has utilized it as the core of its in-house power generation. There are 17 hydroelectric power plants (including jointly funded companies) in total near the Omi Plant, boasting a total power generation capacity of approximately 140,000 kW, making it one of the largest scale in Japan. These power plants not only provide stable electricity supply but also contribute significantly to decarbonization as clean energy sources that emit no greenhouse gases.
In recent years, we have been working on the development of new power sources, including the commencement of operations at the New Omi River Power Plant in fiscal 2020 and the New Himekawa No.6 Hydroelectric Power Plant of Kurobegawa Electric Power Company in fiscal 2022, and have been expanding our power generation capacity. Going forward, we will continue to position hydroelectric power as the core of our power generation portfolio and promote its development and utilization.

 New Omigawa Hydroelectric Power Plant (Started operation in 2021)
 New Himekawa No.6 Hydroelectric Power Plant (Started operation in 2022)
The Company promotes energy conservation through facility improvements and operational optimizations. To date, we have introduced high-efficiency gas turbines at the Omi Plant and Chiba Plant, and have been working to improve energy efficiency through large-scale capital investments.
In recent years, with large-scale projects becoming limited, we have been re-examining energy usage at each of our business sites and strengthening improvements by identifying individual themes and building them up.
Going forward, we will continue to combine our daily improvement activities with facility updates to achieve both energy reductions and increased productivity.
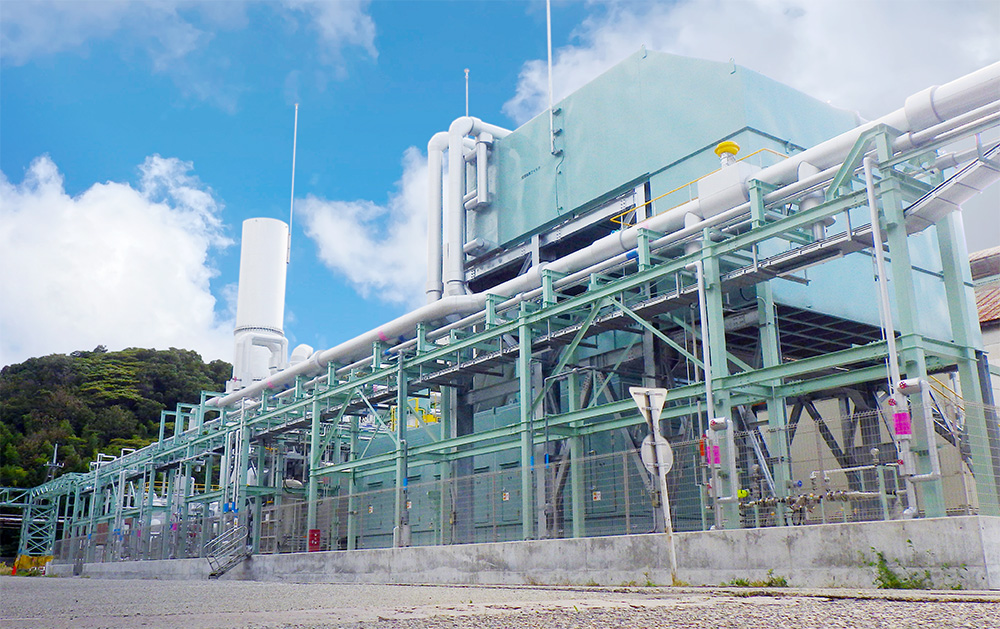 Gas turbine power generation facility at Omi Plant that commenced operation in 2020
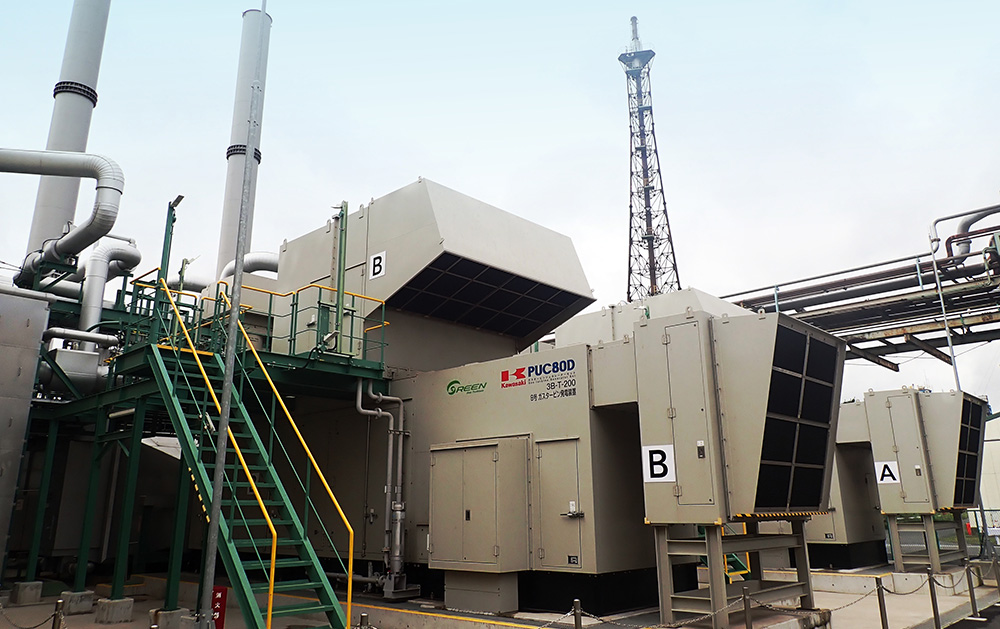 Gas turbine power generation facility at Chiba Plant that commenced operation in 2022
The Company is promoting the introduction of solar power generation at its business sites in Japan and overseas to expand the introduction of renewable energy. In fiscal 2025, a solar power generation system (approximately 1.2 MW) using the on-site PPA method will start operation at the Chiba Plant. Furthermore, the Company is considering new introductions using the on-site PPA method at several sites in Japan and overseas, and will promote the expansion of solar power generation and the decarbonization of electricity by selecting the optimal introduction methods according to the site conditions and power demand of each business site.
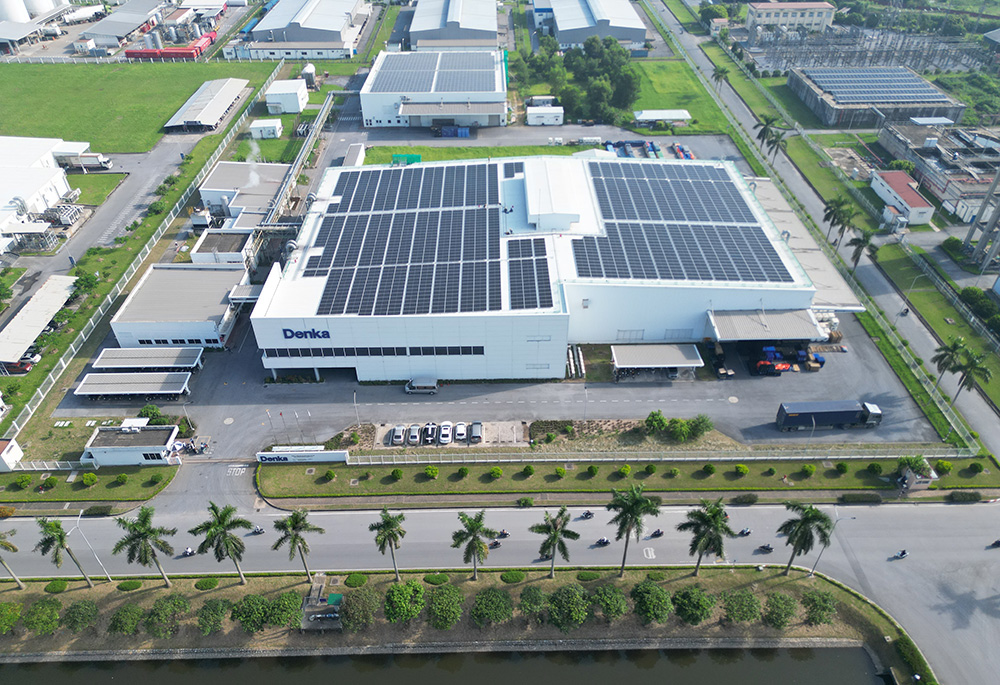 Denka Advanced Materials Vietnam Plant Solar Panels
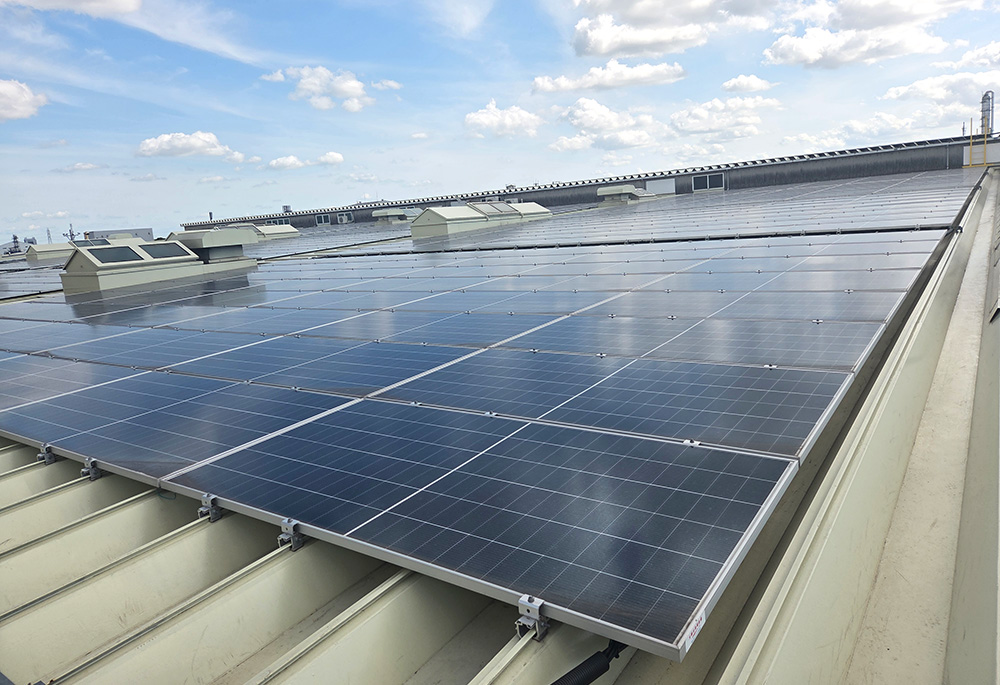 Solar panels at Chiba Plant
Our company and Denka Kojundo Gas Kabushiki Kaisha ※ submit energy-saving investment plans to the Minister of Economy, Trade and Industry and implement these plans in order to receive the special measures for the surcharge system based on the Act on Special Measures Concerning the Use of New Energy Sources.
hydroelectric power plant (map)

| Facilities | Map | 2023年度 | 2024年度 | 2025年度 | ||||||||||
|---|---|---|---|---|---|---|---|---|---|---|---|---|---|---|
| Maximum output (kW) | Company's maximum output (kW) |
Maximum output (kW) | Company's maximum output (kW) |
Maximum output (kW) | Company's maximum output (kW) |
|||||||||
| Hydroelectric | 1 | Omigawa | 3,300 | 3,300 | 3,300 | 3,300 | 3,300 | 3,300 | ||||||
| 2 | Kotagikawa | 5,200 | 5,200 | 5,200 | 5,200 | 5,200 | 5,200 | |||||||
| 3 | Mesh | 28,400 | 28,400 | 28,400 | 28,400 | 28,400 | 28,400 | |||||||
| 4 | Oosogawa | 9,800 | 9,800 | 9,800 | 9,800 | 9,800 | 9,800 | |||||||
| 5 | YOKOGAWA 1ST | 10,000 | 10,000 | 10,000 | 10,000 | 10,000 | 10,000 | |||||||
| 6 | YOKOGAWA 2ND | 16,000 | 16,000 | 16,000 | 16,000 | 16,000 | 16,000 | |||||||
| 7 | KAIKAWA DAIICHI | 3,800 | 3,800 | 3,800 | 3,800 | 3,800 | 3,800 | |||||||
| 8 | Mikawa 2nd | 4,700 | 4,700 | 4,700 | 4,700 | 4,700 | 4,700 | |||||||
| 9 | Kaigawa 3rd | 2,600 | 2,600 | 2,600 | 2,600 | 2,600 | 2,600 | |||||||
| 10 | KAIKAWA YONTH | 990 | 990 | (FIT) | 990 | 990 | (FIT) | 990 | 990 | (FIT) | ||||
| 11 | HIMEKAWA 6TH | 26,000 | Kurobe Electric Power Co. | 13,000 | 26,000 | Kurobe Electric Power Co. | 13,000 | 26,000 | Kurobe Electric Power Co. | 13,000 | ||||
| 12 | Takiue | 15,000 | Kurobe Electric Power Co. | 7,500 | 15,000 | Kurobe Electric Power Co. | 7,500 | 15,000 | Kurobe Electric Power Co. | 7,500 | ||||
| 13 | Mizuki | 5,000 | Kurobe Electric Power Co. | 2,500 | 5,000 | Kurobe Electric Power Co. | 2,500 | 5,000 | Kurobe Electric Power Co. | 2,500 | ||||
| 14 | Sasakura No. 2 | 10,200 | Kurobe Electric Power Co. | 5,100 | 10,200 | Kurobe Electric Power Co. | 5,100 | 10,200 | Kurobe Electric Power Co. | 5,100 | ||||
| 15 | Kita-Kotani | 10,700 | Kurobe Electric Power Co. | 5,350 | 10,700 | Kurobe Electric Power Co. | 5,350 | 10,700 | Kurobe Electric Power Co. | 5,350 | ||||
| 16 | New Seihai River | 8,100 | 8,100 | (FIT) | 8,100 | 8,100 | (FIT) | 8,100 | 8,100 | (FIT) | ||||
| 17 | Shinhimekawa No. 6 | 27,900 | Kurobe Electric Power Co. | 13,950 | (FIT) | 27,900 | Kurobe Electric Power Co. | 13,950 | (FIT) | 27,900 | Kurobe Electric Power Co. | 13,950 | (FIT) | |
| Hydroelectric Total maximum output | 187,690 | 140,290 | 187,690 | 140,290 | 187,690 | 140,290 | ||||||||
| Total in-house consumption (excluding output for FIT) | - | 117,250 | - | 117,250 | - | 117,250 | ||||||||
| Solar Power | Shibukawa | 1,990 | 1,990 | (FIT) | 1,990 | 1,990 | (FIT) | 1,990 | 1,990 | (FIT) | ||||
| Isezaki | 1,000 | 1,000 | (FIT) | 1,000 | 1,000 | (FIT) | 1,000 | 1,000 | (FIT) | |||||
| Chiba | 1,200 | (PPA) | 1,200 | (PPA) | ||||||||||
| DAV | 900 | (PPA) | 900 | (PPA) | 900 | (PPA) | 900 | (PPA) | ||||||
| Solar Total Maximum Output | 2,990 | 2,990 | 3,890 | 3,890 | 5,090 | 5,090 | ||||||||
| Natural gas | Omi | 14,000 | 14,000 | 14,000 | 14,000 | 14,000 | 14,000 | |||||||
| Waste heat/biomass boiler | Omi Cement | 11,100 | 11,100 | 11,100 | 11,100 | 0 | 0 | |||||||
| Gas turbine/Co-generation | Omi (Tomi) | 34,685 | 34,685 | 34,685 | 34,685 | 34,685 | 34,685 | |||||||
| Chiba | 16,620 | 16,620 | 16,620 | 16,620 | 16,620 | 16,620 | ||||||||
| Diesel | Shibukawa | 1,000 | 1,000 | 1,000 | 1,000 | 1,000 | 1,000 | |||||||
| Thermal Total Maximum Output | 77,405 | 77,405 | 77,405 | 77,405 | 66,305 | 66,305 | ||||||||
| Total power generation capacity (including FIT) | 220,685 | 221,585 | 211,685 | |||||||||||
| Total Maximun Output for In-house Consumption | 194,655 | 195,555 | 185,655 | |||||||||||

Consideration for the global environment Support for the RC World Charter (2014 version) ...
Denka accurately understands the environmental burden substances emitted from the production facilities of Group companies and is working on their continuous reduction. The substances targeted include CO2,...
Greenhouse Gas Emissions Zero emissions initiatives ...
Addressing risks and opportunities Addressing risks and opportunities
Expansion of renewable energy and introduction of environmentally friendly power generation technologies In accordance with the...
Company's Approach to Biodiversity The Company recognizes that biodiversity is the basis of the ecosystem that supports human life and corporate activities. The Company also recognizes that the loss of biodiversity due to human activities is a serious global issue. Therefore, the Company is committed to protecting biodiversity and promoting the sustainable use of biological resources in its corporate activities. The Company will also contribute to the conservation of biodiversity through its business activities.
Approach to Resource Circulation (Circular Economy) Chemical Recycling ...
2025 Main Substances Emissions and Water Usage Ratios Headquarters ...